Get the Best Descriptive Data Analysis Services From Our Experts
Statistical methods are generally divided into two types, which include descriptive and inferential techniques, based on the purpose and goal of the research. Descriptive statistical techniques are used to outline data in a sample or population, allowing for a simplified interpretation of the patterns, trends, and relationships between variables in the data set. If you are looking to buy descriptive data analysis services, our experts offer the best solution by numerically or graphically summarizing your data to provide an overview of the characteristics of your dataset. In this article, we delve into descriptive data analysis solutions offered by our statisticians, some of which include descriptive analysis, visualization, interpretation, and reporting services.
What is Descriptive Data Analysis?
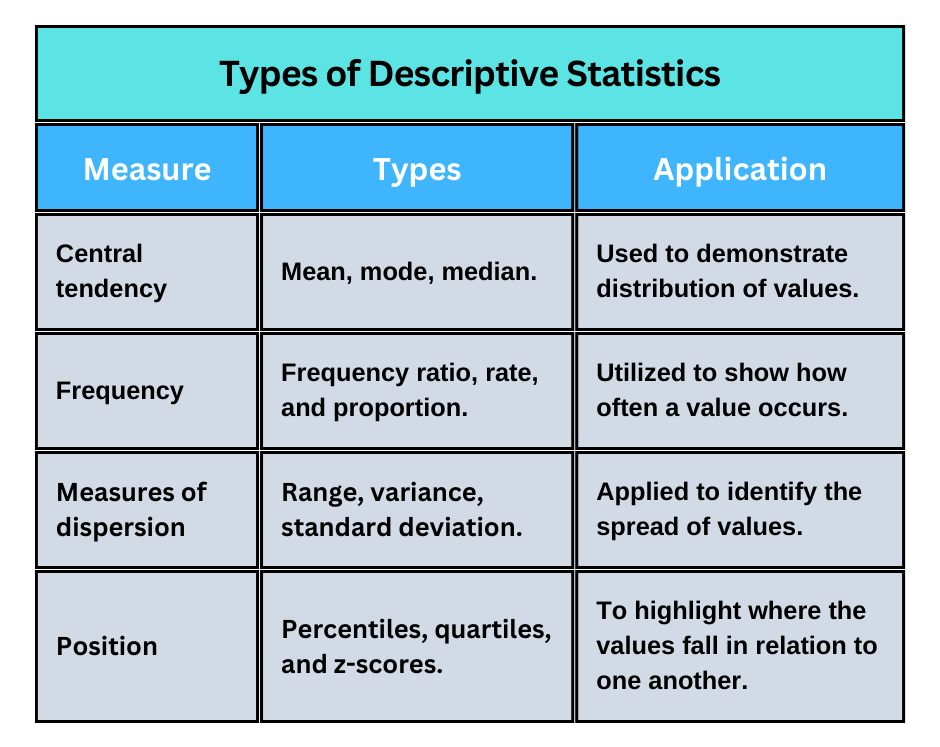
Descriptive data analysis is the practice of summarizing data in the form of simple numerical measures such as frequency distributions or using graphical demonstrations, which include but are not limited to histograms, bar charts, and box plots. Conducting descriptive data analysis is crucial for understanding the important characteristics of a sample and determining the optimal analysis technique to apply for subsequent analyses. For those who need specialized assistance in applying descriptive data analytics, we provide exceptional help to our clients in analyzing and interpreting past data to illustrate the main characteristics of a sample in an easily understandable manner.
Some Descriptive Statistics Services Offered by Our Statisticians
1. Descriptive Data Analysis Services
Our experts clean, analyze, visualize, interpret, and report data as part of our descriptive data analysis services. Examples of descriptive data we analyze include product/service ratings, blood pressure, IQ level, BMI, GDP growth rate, voter turnout, number of participants, duration, and solution concentration. We compute the measures of central tendency, frequency, and variation, and create graphical data presentations to reveal and illustrate patterns and trends in data and relationships between variables.
2. Data Visualization Services for Descriptive Analysis
Data visualization is the representation of data by applying graphical elements such as charts, maps, and figures, among others. We provide data visualization services for descriptive analysis by composing compelling and highly interactive graphics and dashboards, enabling easy understanding of complex information. Our experts apply their analytical skills to design unique visuals depending on the nature of our client’s data that fulfill the intended research objectives.
3. Interpretation and Reporting Services
An accurate and effective data interpretation is crucial to ensure that the analysis findings significantly contribute to the research area, enabling accurate decision-making and easy comprehension of patterns and trends. Our solutions go beyond analyzing data; we help our clients interpret descriptive analysis results. We also write detailed data analysis reports demonstrating the background of the study, the methodology used, the findings, and visual representations.
4. Descriptive Data Analysis Services in SPSS
The Statistical Package for Social Sciences (SPSS) is a powerful software program that statisticians use for descriptive analysis due to its advanced statistical capabilities and sophisticated data visualization capabilities. Our goal in delivering descriptive data analysis services in SPSS is to compute descriptive statistics and demonstrate complex data relationships using visuals in a way that is simple to understand. Through applying Descriptives, Frequencies, and Explore procedures and features such as categorical charts, scatterplots, and density charts, we provide our clients with the best data analysis services in SPSS.
Some of the Descriptive Statistics Tools Used by Our Experts
When clients hire a statistician for descriptive analysis from our company, we make use of software tools such as SPSS, Python, R, Tableau, Excel, and Power BI to compute descriptive statistics or compose visuals that contain an illustration of patterns and trends in data. The type of software we apply depends on the client’s data, research aims, and objectives. To begin with, we utilize Python’s libraries, such as Pandas, Matplotlib, and Seaborn, to offer descriptive analysis solutions by calculating summary statistics and creating graphs.
Additionally, we apply R’s functions and packages such as the summary () and ggplot2 to calculate measures such as the standard deviation, mean, median, mode, and range and compose visualizations, some of which include area plots, bar charts, and histograms. In addition, we use Tableau’s Summary card to work out the average, sum, minimum, maximum, and median values for data. We also utilize Tableau to create visual elements such as charts and graphs, enabling comprehension of data distributions and identifying underlying patterns and trends. Also, our specialists utilize Excel’s Data Analysis Toolpak add-in to access the descriptive statistics and get an overview of the summary statistics in our client’s data. Besides, our experts use Power BI to compute the mean, median, mode, and variance and create highly interactive and customizable dashboards, enabling our customers to understand their data distribution.
Get the Best Descriptive Data Analysis Services in Research from Our Experts
When clients hire our experts for descriptive analysis services from our company, they provide us with: i). The data they have collected, ii). the aims and objectives they intend to achieve, iii). the research questions that need to be answered, iv). specific descriptive statistics that should be addressed, and v). any graphical representations they may require. We then apply our expertise to conduct a rigorous analysis and deliver: i). A clear description of the key characteristics of a dataset, ii). clear visuals demonstrating the patterns in data and relationships between variables, and iii). a comprehensive data analysis report.
Our descriptive analysis specialists help clients simplify complex and large data sets into manageable and easily interpretable information. By providing our clients with an overview of their data’s major characteristics, they easily understand the underlying patterns within their data. Through computing descriptive statistical methods and making clear visuals, our experts provide the best services, helping clients to make evidence-based decisions, conduct accurate subsequent analysis procedures, and derive meaningful conclusions from their data.


Why Hire a Statistician for Descriptive Data Analysis from Our Company?
Our data analysis company has highly skilled statisticians with experience acquired from working with multiple clients in various research fields. Our statisticians are also degree holders in data science, computer science, statistics, and mathematics. We apply these skills and expertise to provide the best descriptive data analysis help to our clients.
We offer comprehensive customer support with 24/7 availability to ensure the timely delivery of analysis results and improve customer satisfaction after buying our descriptive data analysis services.
When clients opt to hire a statistician for descriptive data analysis from our company, they get accurate and reliable findings that result in positive research outcomes.
We provide customized descriptive analysis services for our researchers, doctoral and Master’s students, businesses, and organizations in different disciplines to assist them in summarizing the major characteristics of their dataset and composing visuals.
Summary
Conducting data analysis, either descriptive or inferential analyses, requires analytical skills and expertise to achieve positive and effective research outcomes. Our highly skilled statisticians tailor our descriptive analysis solutions to cater to different clients in multiple areas of study. Want to enquire more about our descriptive data analysis services? Contact our expert consultants now to learn how we can help you describe and summarize data. You can also review our order process to learn how to place an order with us. Our excellent customer service team is always available to respond to your inquiries immediately via our live chat or email.