Understanding and Interpreting Regression Analysis for Your Dissertation
Despite completing coursework, fieldwork, and data collection, most Ph.D. scholars find statistical data analysis to be a major hurdle. Tasks such as testing assumptions, interpreting regression results, and understanding relationships between variables can be challenging without the proper expertise. In case you are stuck with dissertation data analysis, you can hire a statistician to do regression analysis for a dissertation from our company. Our specialized experts support doctoral researchers in producing high-quality analyses that align with academic and institutional requirements. Whether you’re modeling outcome predictors, testing hypotheses, or controlling for confounding variables, we provide the expert assistance needed for success. In this article, we provide an explanation of linear and multiple regression analysis, including its application and interpretation, among other topics.
What is regression analysis?
Regression analysis refers to a statistical method applied to assess the relationship between dependent and independent variables. Researchers use regression analysis to quantify the relationships between variables, determining the significance, strength, and direction of dependent and independent variables. Regression analysis is a widely accepted and commonly used statistical method in the social sciences, business, education, health sciences, and psychology. Regression analysis allows researchers to test hypotheses, forecast future trends, and control for external factors by modeling the effects of predictor changes on outcomes. Regression analysis enables researchers to transform raw data into usable knowledge that can be incorporated into academic literature and research. The two main types of regression models are linear and multiple regression.
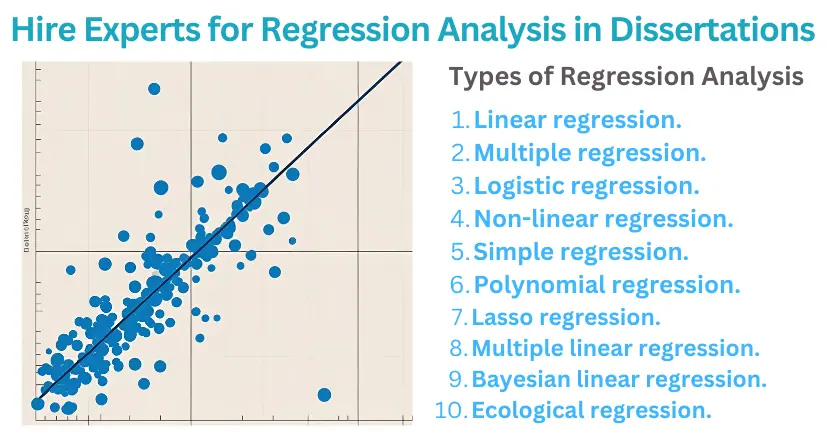
Types of Regression Analysis
1. Linear Regression
Linear regression is used to examine the association between a single independent and one dependent variable by having a straight line through the data. Linear regression’s basic formula is: Y = β₀ + β₁X + ε, where Y is the outcome or dependent variable, X is the predictor or independent variable, and β₀ is the intercept (value of Y when X = 0). β₁ is the slope (change in Y for each unit change in X), and ε is the error term.
2. Multiple Regression
The multiple regression builds upon linear regression by adding two or more independent variables. Multiple regression is applied where the result depends on multiple factors. Multiple regression’s general formula is: Y = β₀ + β₁X₁ + β₂X₂ + … + βnXn + ε. The formula enables the researchers to isolate the effect of one variable at a time, controlling the rest. Multiple regression is an effective instrument in complex dissertation analysis, whereby different variables can play a role in the phenomenon.
Application of Regression in Dissertation Research
In dissertations, regression analysis is used to predict dependent variables, test hypotheses, and evaluate theoretical frameworks. Linear regression is typically applied when only one predictor is under investigation, for example, to determine whether study time affects examination marks. This application is best suited for exploratory research or where theory highly postulates a major influencing factor.
Multiple regression is utilized in cases where the researcher is interested in considering the influence of more than one predictor. For example, in a doctoral dissertation on education, researchers may explain student performance in terms of class attendance, class size, and parental involvement. Researchers can include class attendance, size, and parental involvement variables in a single model to understand the specific role of each of them. In either case, regression helps the researchers shift the relationship to explanation. Not only does regression provide answers to the existence of relationships, but also the extent to which they are crucial.
Analysis and Diagnostics of Regression Analysis
There are several steps to be undertaken when performing linear or multiple regression analysis to ensure results are interpretable and valid. These steps include data preparation, exploratory data analysis (EDA), model specification, assumption checking (diagnostics), regression analysis, interpretation, and reporting. Regardless of whether one uses linear or multiple regression, the following diagnostics are required to ensure the reliability, accuracy, and validity of the regression model:
- Linearity: The relationship between the outcome and predictors must be linear.
- Independence: The observations have to be independent of one another.
- Homoscedasticity: The residuals (errors) are to be homoscedastic (have constant variance).
- Normality of residuals: The distribution of residuals ought to be normal.
- No multicollinearity (in multiple regression): The predictors must not be highly related.
Scatterplots, residual plots, Q-Q plots, and Variance Inflation Factor (VIF) are some tools that researchers use to check these assumptions. In case assumptions are not met, findings can be false or inaccurate. Our statisticians help clients check test assumptions and make changes to increase model accuracy.
Interpretation of Regression Analysis Findings
After fitting the regression analysis model and validating assumptions, researchers aim to comprehend the meaning of the results through data interpretation. The following are the key metrics for data interpretation:
1. Coefficients (β values)
β values are the effect sizes of the predictors. In linear regression, the slope indicates the rate at which the outcome changes for a one-unit increase in the predictor. In multiple regression, the coefficient measures the impact of a variable while keeping others constant.
2. R-squared (R²)
R² indicates the proportion of variability in the outcome that the model accounts for. Adjusted R² is frequently applied in multiple regression because it reflects the number of predictors. A higher R² value represents a better-fitting model; however, research design and context also determine its interpretation.
3. P-values
P-values indicate whether each predictor has a statistically significant impact on the outcome. The p-value is usually considered significant when it is less than 0.05. However, researchers can consider effect sizes because statistical significance does not always mean practical importance.
4. Confidence Intervals
Confidence intervals indicate the range within which the effect is likely to be found, thereby strengthening the interpretation of the results. Confidence intervals provide more information than p-values by showing the estimated effect’s direction and precision. Wider confidence intervals suggest greater uncertainty in the results, while narrow confidence intervals indicate more accurate estimates.
Example of a Public Health Dissertation Using Regression Analysis
Consider a doctoral public health dissertation in which the researcher investigates the effect of physical activity, age, and chronic illness on quality of life. The researcher uses a multiple regression analysis model to evaluate the contribution of each physical activity, age, and chronic illness on the outcomes while holding the other factors constant. Interpreting effect sizes, understanding interaction terms, and testing assumptions can be challenging for researchers due to the advanced statistical knowledge required for these tasks. However, engaging an expert statistician ensures effective communication of findings, appropriate model use, and a thorough understanding of the data. Our experts ensure that clients submit and defend their dissertations on time by providing comprehensive statistical support, effective data processing, and customized feedback throughout the dissertation process.
Benefits of Hiring a Statistician to Do Regression Analysis for a Dissertation
- A statistician ensures that all the key assumptions are tested and addressed. The regression analysis contains several assumptions, including normality of residuals, linearity, homoscedasticity, and independence of errors. Failure to meet the assumptions can cause the estimates to be biased and the conclusions misleading. Our statisticians help researchers with diagnostic tests and corrective approaches to maintain the integrity of analysis.
- Experts help interpret the statistical results to align with research objectives. Interpreting statistical results is not just about reading coefficients; it necessitates connecting the results with research questions and theoretical frameworks. Interpreting statistical results improves the study’s rationality and strengthens the discussion chapter.
- Professional support involves helping with presenting findings in an accurate academic format. Our statisticians assist in organizing results sections in all formatting styles or subject-specific guidelines. Expert statisticians help present coefficients, p-values, and confidence intervals as readable tables and figures. Proper and accurate formatting ensures the results are reviewable and meet the committee’s expectations.
- Hiring our statisticians gives our clients peace of mind and saves them time. By hiring our experts, our clients save time to concentrate on other academic activities and have peace of mind, knowing they are assured of quality services and timely delivery of their dissertation data analysis.


Why Hire a Statistician to Do Regression Analysis for a Dissertation?
One must possess the expertise and skills necessary to utilize statistical software accurately to conduct regression analysis effectively. Choosing to hire a statistician to conduct regression analysis for a dissertation is a strategic move that can increase the dissertation’s quality, efficiency, and credibility. Our experts ensure clients’ dissertation regression analyses are statistically accurate, methodologically sound, and interpreted for academic success.
We are aware of the financial challenges associated with doctoral life, so our pricing is affordable. Whether it is a complex multiple regression with interaction terms or a simple linear model, our services are customized depending on the scholars’ analytical requirements.
All projects are handled by qualified and experienced personnel. We ensure that we assign tasks to subject matter experts for the best results. Our statisticians possess advanced analytical skills and a strong track record of supporting dissertations in various disciplines, including business, education, public health, psychology, and other fields.
The distinguishing feature of our regression analysis services is our 24/7 support system. Time zones, deadlines, and last-minute questions have never been barriers to helping clients. We provide researchers with immediate explanations and rapid amendments.
Every regression analysis service is custom-tailored to correspond to the study’s goals, design, and data type. Each regression analysis stage is individualized, including data cleaning, assumption testing, and the write-up. Through our customized services, we ensure that clients’ statistical analyses are technically accurate and align with the research objectives and expectations of their dissertation committees.
Summary
Regression analysis enables researchers to verify relationships, assess predictors, and generate conclusions that develop knowledge in their discipline. Nevertheless, appropriate regression analysis requires a thorough understanding of statistical assumptions, model diagnostics, and the interpretation of results. Most doctoral researchers prefer seeking an expert’s assistance, not because they are incompetent but because they understand the intricacy of regression analysis. For those who wish to hire a statistician to do regression analysis for a dissertation, contact our experts today for the best data analysis support. Our customer support team is available 24/7 via live chat to ensure that we serve you at your convenience, at any time, any day.